Difference between revisions of "Gnuplot"
From Linuxintro
imported>ThorstenStaerk |
imported>ThorstenStaerk |
||
| Line 5: | Line 5: | ||
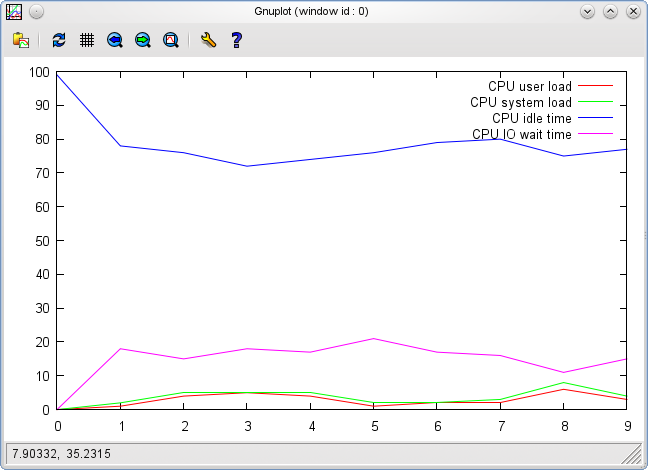
The result will look like this: | The result will look like this: | ||
| − | + | [[Image:Snapshot-gnuplot.png]] | |
Revision as of 12:37, 11 December 2010
Here is an example how to visualize vmstat's output using gnuplot.
vmstat 1 10 | grep -v r > vmstat.txt
gnuplot -p -e "plot 'vmstat.txt' using 13 title 'CPU user load' with lines, 'vmstat.txt' using 14 title 'CPU system load' with lines, 'vmstat.txt' using 15 title 'CPU idle time' with lines, 'vmstat.txt' using 16 title 'CPU IO wait time' with lines"
