Difference between revisions of "Ksar"
From Linuxintro
imported>ThorstenStaerk |
imported>ThorstenStaerk |
||
| Line 3: | Line 3: | ||
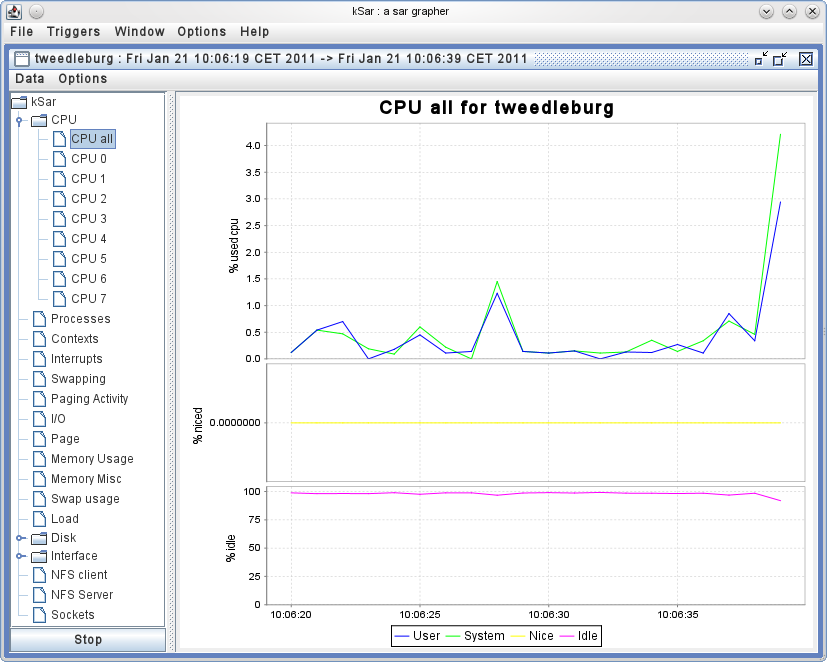
[[Image:Snapshot-ksar.png]] | [[Image:Snapshot-ksar.png]] | ||
| − | [[sar]] -o /tmp/sar.out 1 20 | + | To get this graph, |
| − | export LC_ALL=C; sar -A -f /tmp/sar.out >/tmp/sar.out.txt | + | * collect all system data, in this example for ''20'' intervals lasting ''1'' second each, using the data file ''/tmp/sar.out'': |
| − | java -jar kSar.jar -input /tmp/sar.out.txt | + | [[sar]] -o ''/tmp/sar.out'' ''1'' ''20'' |
| + | * convert the binary data to a human-readable format. -A stands for "all". | ||
| + | export LC_ALL=C; sar -A -f ''/tmp/sar.out'' >''/tmp/sar.out.txt'' | ||
| + | * [http://sourceforge.net/projects/ksar/ Download and install kSar] | ||
| + | * run kSar using the human-readable data file: | ||
| + | [[java]] -jar kSar.jar -input ''/tmp/sar.out.txt'' | ||
= See also = | = See also = | ||
* [[gnuplot]] | * [[gnuplot]] | ||
Revision as of 09:28, 21 January 2011
This article is about getting statistics about past system activity like this:
To get this graph,
- collect all system data, in this example for 20 intervals lasting 1 second each, using the data file /tmp/sar.out:
sar -o /tmp/sar.out 1 20
- convert the binary data to a human-readable format. -A stands for "all".
export LC_ALL=C; sar -A -f /tmp/sar.out >/tmp/sar.out.txt
- Download and install kSar
- run kSar using the human-readable data file:
java -jar kSar.jar -input /tmp/sar.out.txt
